This article is part of our “Channel Marketing series” – with tools, tips and tutorials to help you create and manage an effective channel partner program.
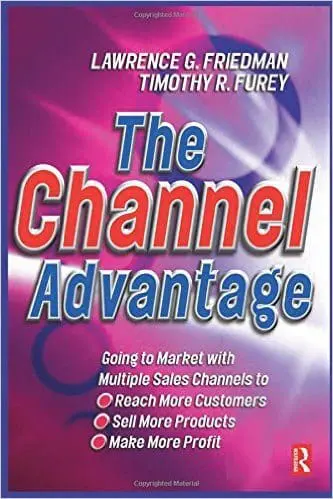
 Over the last few weeks, I’ve been perusing the most excellent book, a classic channel marketing work titled The Channel Advantage by Friedman and Furey. Written over 15 years ago, the book delivers page after page of fundamental truths that are still essential for any channel leader.
One of the topics covered in Chapter 4, The impact of products on channel selections is the Channel Touch Continuum. I love this diagram of the continuum because it helps to explain the position of various marketing strategies in relation to the type of sale to be conducted. Take a look at the diagram here, circa 1999.
The Choices on the Continuum
At the lower left-hand corner of the diagram, the low cost per transaction sale with low-value is shown with web-only direct marketing channels. As the value of the sale increases, however, so does the cost per transaction. In the upper right-hand corner we see the high-value sale with high costs per transaction. Here direct sales forces are clearly involved. Along the continuum between these extremes lie a variety of logical choices for channel marketing. As the diagram indicates, there is not a single unique channel for a given set of value-add/cost per transaction combinations. Rather, there are several choices which can also overlap.
Three Examples of the Marketing Continuum
- For example, one of our clients sells a lower cost $200/year subscription to companies that typically invest thousands for similar services. The transaction can be fulfilled with a web-base sign up with no support. This is lower right-hand corner positioned sale. We concentrate all our efforts in web-based and email marketing.
- In other instance, we assist our client in selling $200/month subscriptions to companies who need a little assistance in understanding the service and in setting up the service. Here we lead with email and direct marketing but quickly supplement with VAR partners to sell and fulfill the setup. This puts us in the middle of the continuum.
- Finally, one of our clients sells a membership for several tens of thousands of dollars that also requires significant pre-sales education and post-sale training for a successful engagement. For this we initially begin our engagement with telemarketing and email outreach, which quickly evolves into direct sales with online presentations, onsite visits and more.What I don’t like about the diagram is the perception that it gives that the various channels are so defined when in fact the solid oval line around each channel would be a represented by a broader oval with a less distinct outline. Alas, perhaps there is room for a 2015 updated diagram. Stay tuned.
How to Use the Continuum
With this graphic, I envision being able to help a CEO or sales leader think through the options for go-to-market strategies. I have had discussions like this most often with a CEO who is frustrated with the lack of progress in his/her current strategy. The CEO has to evaluate if the current strategy is wrong and he/she needs to change strategies, or if he/she is on course but needs to change tactics with the current strategy.
One Final Note
Remember that this graphic is designed to show the continuum in concept. Actual application of it will often entail an overlap of some adjoining strategies. In particular, web/inbound strategies will overlap with telemarketing and other strategies as the software tools for inbound marketing improve and use of the web becomes ever more pervasive.
See how we can put these concepts to use in your company with a free 30-minute channel partner program review.


