 A Google search for “build sales pipeline” yields over 4 million pages of results. And a similar search for “accelerate sales pipeline” yields only 212,000 results. One could easily conclude that many fewer people know anything about accelerating pipeline results.
Over the past 4 years of inbound marketing for a wide variety of B2B clients, we’ve found that it’s fairly easy to build a pipeline and accelerate the results – but it’s much harder to build predictable results.
And after all, as a top leader in your company, isn’t that what you really want? You want to know what you can count on Marketing to deliver – not last month, but this month, and next quarter and the quarter after that!
Having predictable results would allow you to forecast revenue not just for this month, but for the next several quarters.
The basis for prediction
Being able to accurately predict flow through your sales pipeline requires a hard look at your historical data.
It would be simple if we could just say to Marketing, “Crank it up, team!” and have them send out a few more emails, start another persona-based campaign, or tweak a landing page to produce more engagement. They can do those things and more, but that brings only volume, not predictability. Volume is good and necessary, but it doesn’t allow us to set reasonable expectations for the future.
In fact, predictability isn’t solely in the hands of Marketing – the Sales team owns some of this. What is their closing rate? Do they have a solid sales process? Do they have all the collateral they need? Do they feel empowered? How do they handle leads that aren’t ready to buy yet for whatever reason?
Marketing should be able to help find answers to these and other questions from your sales team, and then fill the gaps or needs that are discovered.
An example
Consider an organization we have worked with. They have a long history but are now in a turnaround situation. Sales and marketing have been faltering for the past several years, morale was down, leadership was weak.
Now there is new leadership team in place and they have “cleaned house” – people who could readily adopt the new vision of success and new ways of achieving it got excited and the other employees left.
In this case, there is a wealth of historical data – but it was all derived from the old model of doing business and its relevance to the new model was questionable.
Existing data is an unreliable indicator of pipeline strength in a turnaround situation.
We were asked to be their external marketing partner while they rebuild and create an internal marketing team. We looked at their existing data and agreed with them that this was an unreliable indicator of future pipeline strength.
Clearly, the place to start was to develop a gameplan strategy and then generate more web traffic, more conversions, more engagement – the basics of inbound marketing.
As we launched new inbound marketing campaigns, we started talking with a wide variety of people in the company and began discovering some interesting things:
- The remaining staff members were enthusiastic about the new vision and were happy to talk about what worked and what didn’t work well in their particular areas. This made it easy to get a better picture of the overall buyer’s journey and find the “holes” where they were losing prospects.
- They were spending $10,000 per month (a legacy of the previous leadership) on PPC which was poorly targeted and completely untracked in terms of results. No one in a decision-making role even knew about this spend!
- The sales team had a high closing rate – but for those who weren’t yet ready to buy, there was no nurturing campaign in place – Sales simply called back six months later to see if they were ready to buy.
- The sales team also did not have current collateral to send to their prospects – everything they were using was from the old regime and did not reflect their new products and services.
- The professional staff was eager (and a little skeptical) to participate in “getting the word out,” but needed direction and some training in how best to do this. Any conversations with them needed to be tailored individually to these own needs, goals, and abilities.
- Other business units in the company became interested in what we were doing and were cautiously willing to help.
Using the Inbound Marketing Revenue Calculator to help set goals
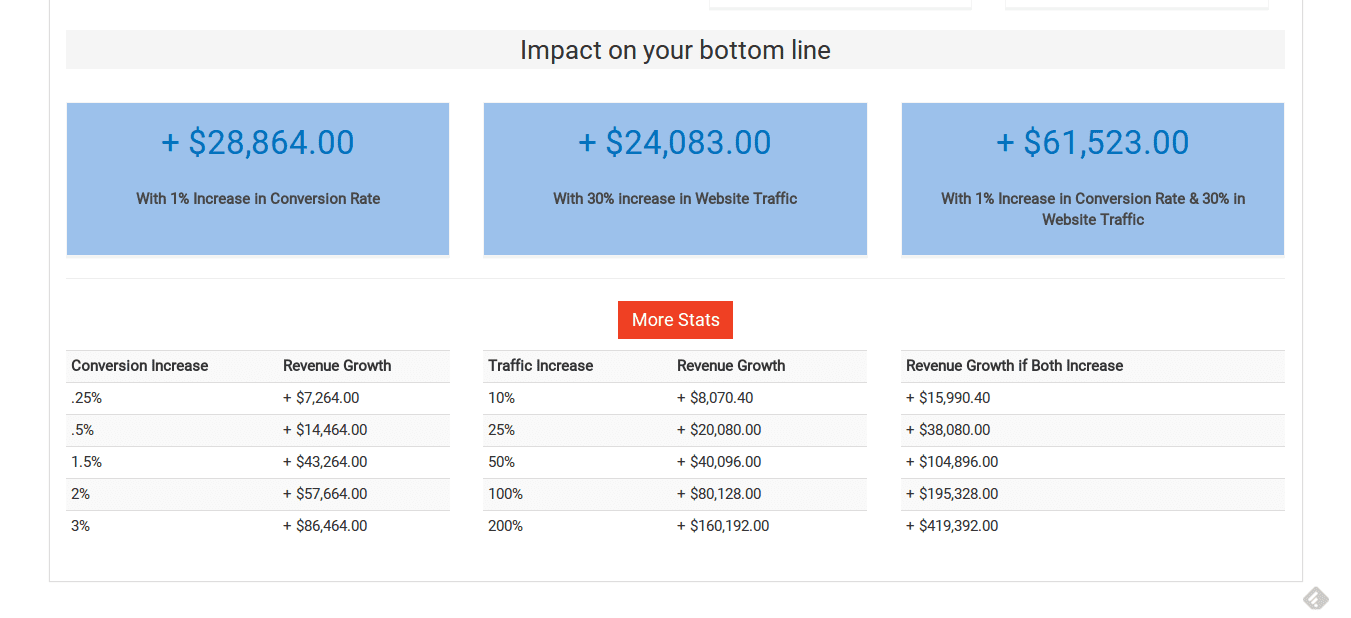
With this research done, and with the leadership team fully cognizant of our discoveries, we introduced the idea of creating an Inbound Marketing Revenue Calculator that would allow everyone to see how some small changes in key metrics would drive new revenue. This proved to be a very useful tool for building consensus around exactly what metrics needed to move.
If the journey of a thousand miles starts with one step, the first step to measuring inbound marketing ROI begins with just five numbers:
- Average Monthly Visitors to Your Site – This can be obtained from your HubSpot software or Google Analytics.
- Average Leads Per Month from Your Site – How many monthly leads are you generating through your site? Leads are people who have provided their email address to you. That could be in return for downloading an ebook, subscribing to a newsletter, requesting a quote, etc.
- Percentage of Qualified Leads – Of those leads described in #2 above, what percentage of them are qualified to enter your sales process?
- Close Rate – What is your percentage of qualified leads who become customers?
- Customer Lifetime Value – What is the average lifetime value of a customer for your company? If a customer represents more than a one-time occurrence, add up what you make from a customer over the course of a relationship.
For this client, it was clear that a 1% increase in conversion rate of website visitors, and a 30% increase in visitor traffic, combined to make a $750,000/year increase in revenue. And that’s before we address any inefficiencies in sales!

Now, instead of simply saying “we need more revenue,” we have clear marketing goals for the year:
- Increase web traffic by 30%
- Increase conversion rate of visitors-to-leads by 1%
- Continue to work for other efficiencies
OK, but what about predictability?
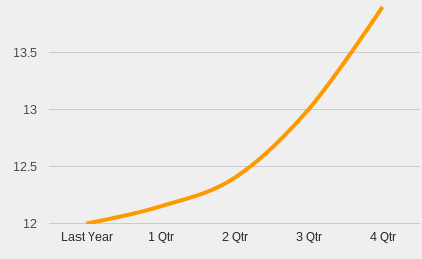
We can now see how taking 5 current metrics (as noted above) and applying a little math, courtesy of the inbound marketing calculator, we can predict lead flow, and therefore revenue growth. We could apply these changes to a chart over the next 4 quarters and have quarterly goals throughout the year.
Then we can tailor our marketing campaigns to meet these quarterly goals and we have a predictable sales pipeline. If there is any seasonality in your sales cycle, be sure to factor that in when laying out quarterly goals.
Now, any good inbound marketer can understand what tactics to use to produce incremental changes, and you, as the CEO, COO, or VP Sales, have an understanding of how these small changes compound into significant and predictable revenue growth.


