 B2B inbound marketers are obsessed with metrics. We measure all kinds of things like email opens, and clickthrough rates, and A/B test results — all to help us find little things that we can use to tweak our results.
But your CEO isn’t particularly interested in those metrics. She wants to know real revenue numbers attributable to your marketing, and real ROI.
Let’s explore tweaking things much higher up the funnel, like website traffic and conversion rate from that traffic, and see how those simple metrics can work some real magic in driving new revenue.
We’ll collect just five metrics and then do some simple math. If fact, here’s the calculator we’ll be using.
5 simple metrics you can easily obtain
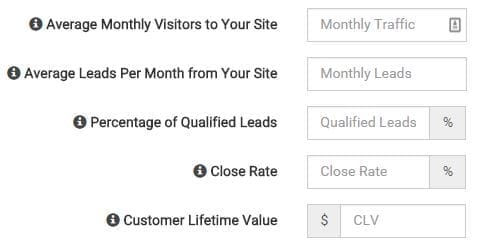
These are the five metrics you’ll need:

- Average Monthly Visitors to Your Site. What is your average monthly traffic? Hint: use Google Analytics, HubSpot, or a similar service to find this information.
- Average Leads Per Month from Your Site. How many monthly leads do you currently generate through your website?
- Percentage of Qualified Leads. How many of your average monthly leads are qualified to enter your sales process?
- Close Rate. What is your percentage of qualified leads who become customers? This is the overall closing rate of your sales team.
- Customer Lifetime Value. What is the average lifetime value of a customer for your company?
For our example, let’s assume these are the 5 metrics for our company:
Monthly visitors = 10,000
Leads/Month = 250
Qualified Leads = 25%
Close Rate = 30%
Lifetime Value = $10,000
Now the fun begins!
The Inbound Revenue Calculator
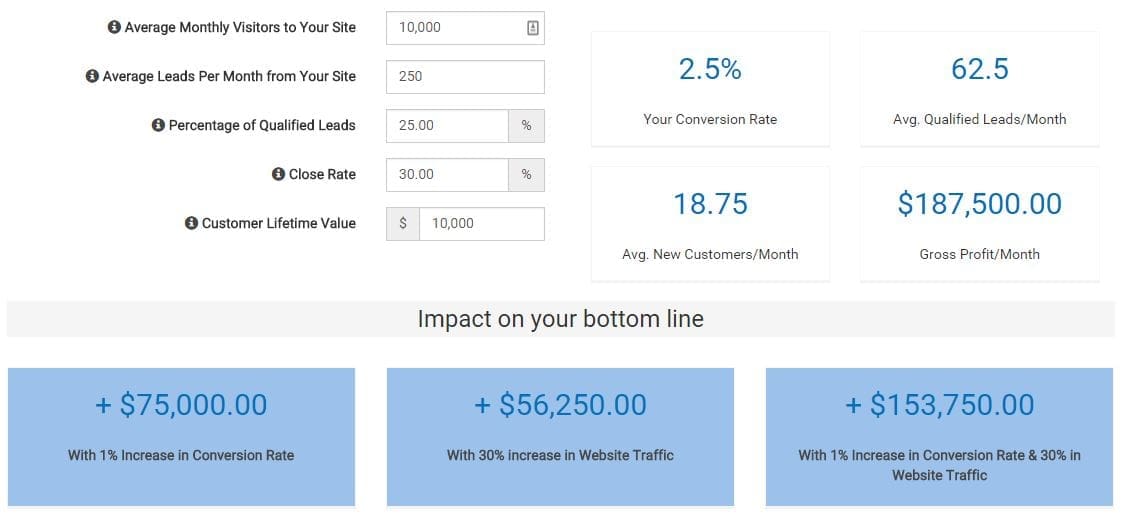
When we plug these number into the Inbound Revenue Calculator, we get the following results:

Notice that the Conversion Rate of 2.5% is the ratio of Monthly Leads to Monthly Visitors. This is a critical number that tells you now many visitors become leads (fill out a form) out of every 100 people who visit your site .
Average Qualified Leads per Month is simply the product of multiplying the Percent of Qualified Leads by the number of Leads per Month. In this case, you could expect 62 Qualified leads per month.
These leads then give you almost 19 New Customers/Month (Monthly Leads x Close Rate).
Those new customers with a lifetime value of $10,000 turn into $187,500 Gross Profit/Month.
Based on our data, these are now our predictable monthly results. We get traffic to the website, some of which converts into leads, and some of the are qualified and passed to sales, who then close a few, and produce a gross profit. This is pretty simple math.
So where’s this BIG change in ROI?
Now we’re making progress, because we know what to expect based on the current metrics.
However, in the left blue box in the image above, we see that if we can increase our Conversion Rate (the rate at which web visitors become leads) by 1%, we add another $75,000 to the gross profit. That’s a 40% increase in gross profit!
In the center blue box, increasing our website traffic by 30% adds $56,250 to the gross profit. That’s a 30% increase in gross profit!
But in the right blue box, we have a surprise when compounding the impact of a 1% increase in our Conversion Rate paired with a 30% increase in website traffic — we add $153,750 to the gross profit! This is an increase of 82% in gross profit!
A 1% increase in Conversion Rate, coupled with a 30% increase in website traffic, almost doubles our monthly revenue! Now we’re talking some real ROI!
Sure that looks great — but let’s get real!
Maybe you think growing your conversion rate by 1% is hard. Well, yes, it probably is. So let’s back off a bit and be less aggressive with our assumptions.
How does a 0.25% increase in Conversion Rate sound? And only a 10% increase in website traffic? Those two metrics compound to produce over $39,000 in additional monthly revenue.
| Conversion Increase | Traffic Increase | Compounded Revenue Growth |
| .25% | 10% | $39,375 |
| .50% | 25% | $93,750 |
| 1.50% | 50% | $262,500 |
| 2% | 100% | $487,500 |
| 3% | 200% | $1,050,000 |
The point is, by working to increase both your Conversion Rate on your website, as well as increasing your website traffic, you can achieve real revenue growth without spending any additional money. That means a real increase in ROI, which is music to your CEO’s ears. 🙂
Put your numbers into the Inbound Revenue Calculator
Now try it with your numbers. Go to the Inbound Revenue Calculator and put in your numbers. Then click the orange “More Stats” button at the bottom.
Then share this with your marketing team (and your CEO) and decide what increases you think are achievable in the next 90 days — then GO FOR IT!
(By the way, it’s a really good idea to get your sales team in on the game from the beginning. After all, they are going to have a lot more work to do closing all those new sales-qualified leads!)


